
The problem
MicroVision reconstructs the runtime architecture of a complex OpenStack deployment using raw system logs. It is designed for environments where a dependency map is needed but source-code access, distributed tracing, or prior knowledge of service endpoints is unavailable.
Microservice environments often lack an up-to-date view of how services interact. Static analysis can miss runtime behavior, while distributed tracing requires instrumentation that may be expensive or unavailable. Logs are abundant, but their volume and variability make them difficult to use directly for dependency discovery.
My role
I designed and implemented the semantic analysis pipeline, including log parsing, vector retrieval, dependency validation, and graph generation.
How it works
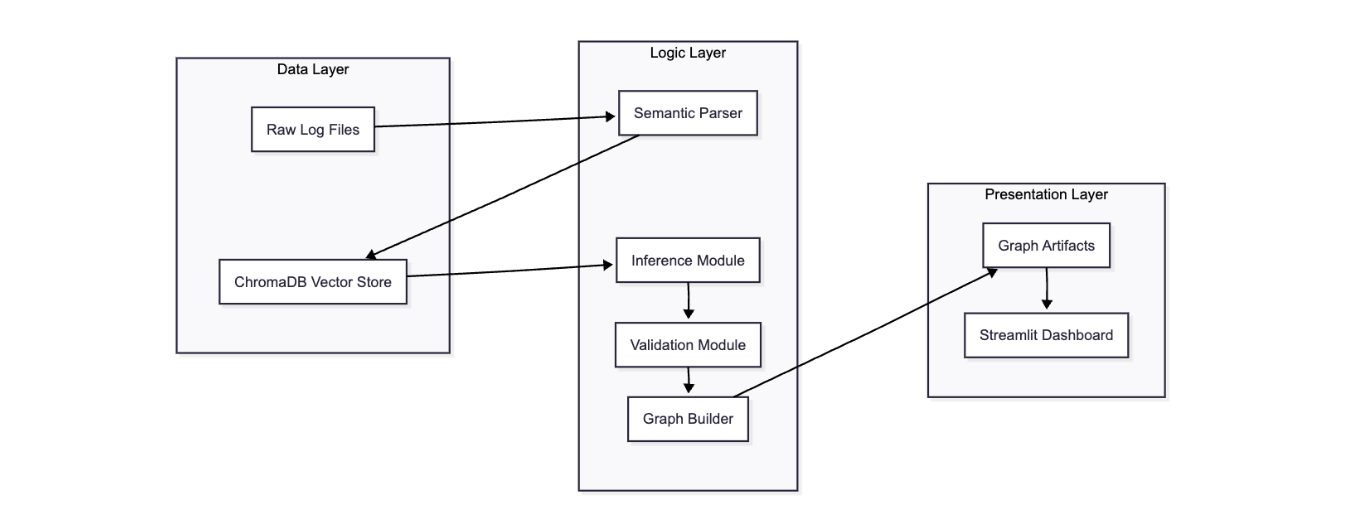
The pipeline ingests raw logs in batch or streaming form, samples representative data, and uses a customized Drain3 parser to extract reusable log templates while masking high-entropy values such as IP addresses and request IDs. The resulting templates are embedded with all-mpnet-base-v2 and stored in ChromaDB for semantic retrieval.
Candidate relationships are then validated with an LLM-as-a-Judge layer. Instead of treating temporal co-occurrence as proof of a dependency, the validator considers the technical context of two log templates and filters likely coincidental edges. The accepted relationships are synthesized into an interactive dependency graph using NetworkX and PyVis, with a Streamlit interface for exploration and forensic analysis.
What changed
On the OpenStack benchmark, MicroVision processed 183,895 log lines and reduced parsing latency to under 12 seconds. Customized template masking reduced template bloat from approximately 25,000 templates to 1,200 core behaviors. The validation layer discarded 42% of candidate edges that were judged coincidental and increased precision from 38% to 54%.
The project reports a 0.54 precision score and a 35% precision improvement over the synthesis baseline. It also reduced the time required to map a new microservice environment from days to minutes. The dashboard includes an Alpha slider so operators can tune discovery sensitivity while inspecting inferred dependencies and supporting reasoning.
Interactive demo subset
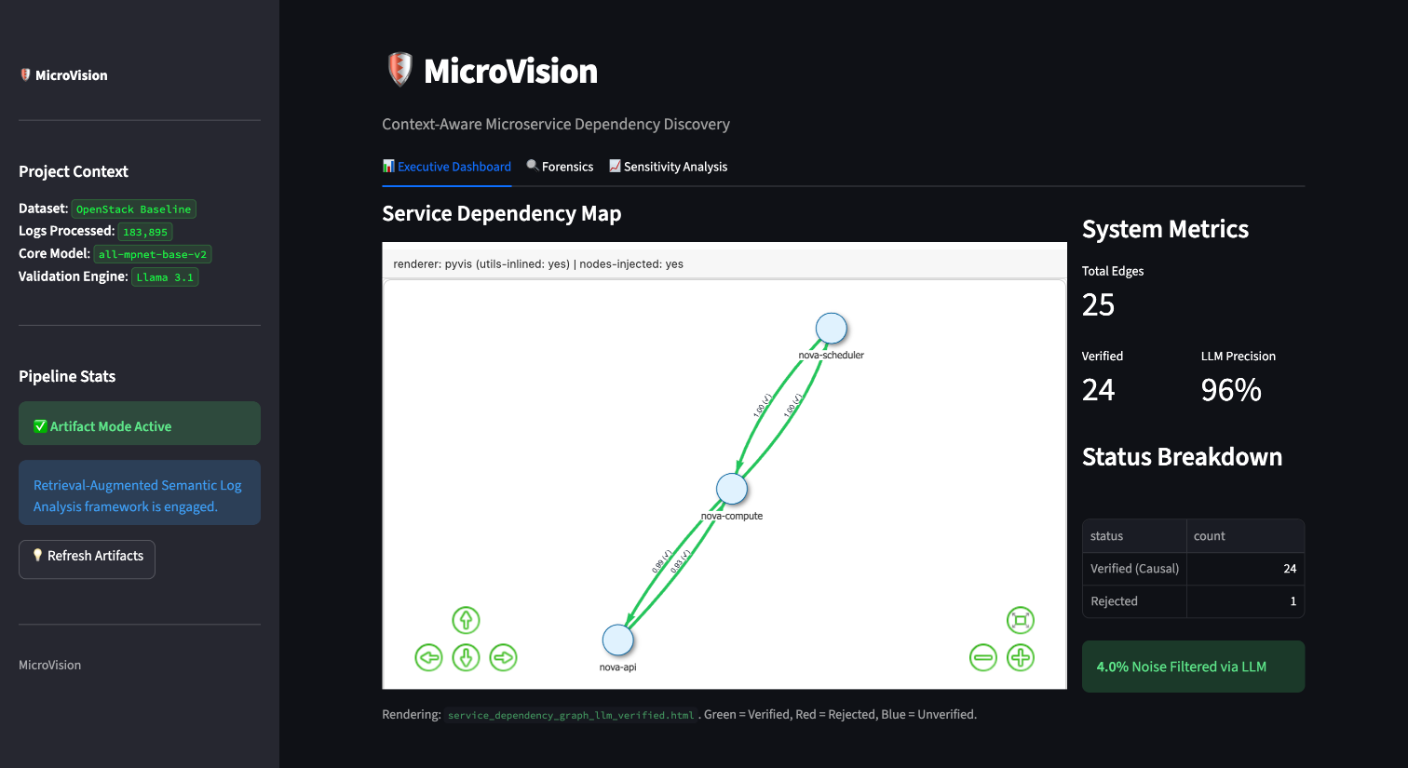
The linked Streamlit dashboard displays precomputed results from a representative subset of the full OpenStack dataset so the interactive demo can start quickly. In that subset, the dashboard shows 25 candidate edges, 24 verified edges, and 96% LLM validation precision. These values describe the demo artifact, not the full benchmark evaluation above.
Constraints and lessons
The approach depends on the quality and representativeness of the available logs, the behavior of the embedding and retrieval layers, and the reliability of LLM-based validation. ChromaDB was selected for zero-configuration prototyping, while the current benchmark workflow uses pre-computed artifacts for fast demo startup.
Next steps
The documented roadmap includes real-time stream processing through Kafka or ELK, anomaly detection using the semantic baseline, and multimodal fusion of log semantics with metric-based causal discovery.